
SHManager™
Web-User-Interface
Permanent condition monitoring systems continuously produce measurement data on a large scale in the best case. Apart from data recording, storage and management, data analysis and visualization and analysis play a decisive role for the further utilization of these data.
The measurement data acquired by sensor are saved on the monitoring computer at the OWEC or OSS be monitored. This monitoring computer automatically evaluates the recorded values and writes the results into the monitoring database located at the clients premises (operational monitoring center) or alternatively at the headquarters of airwerk/VCE.
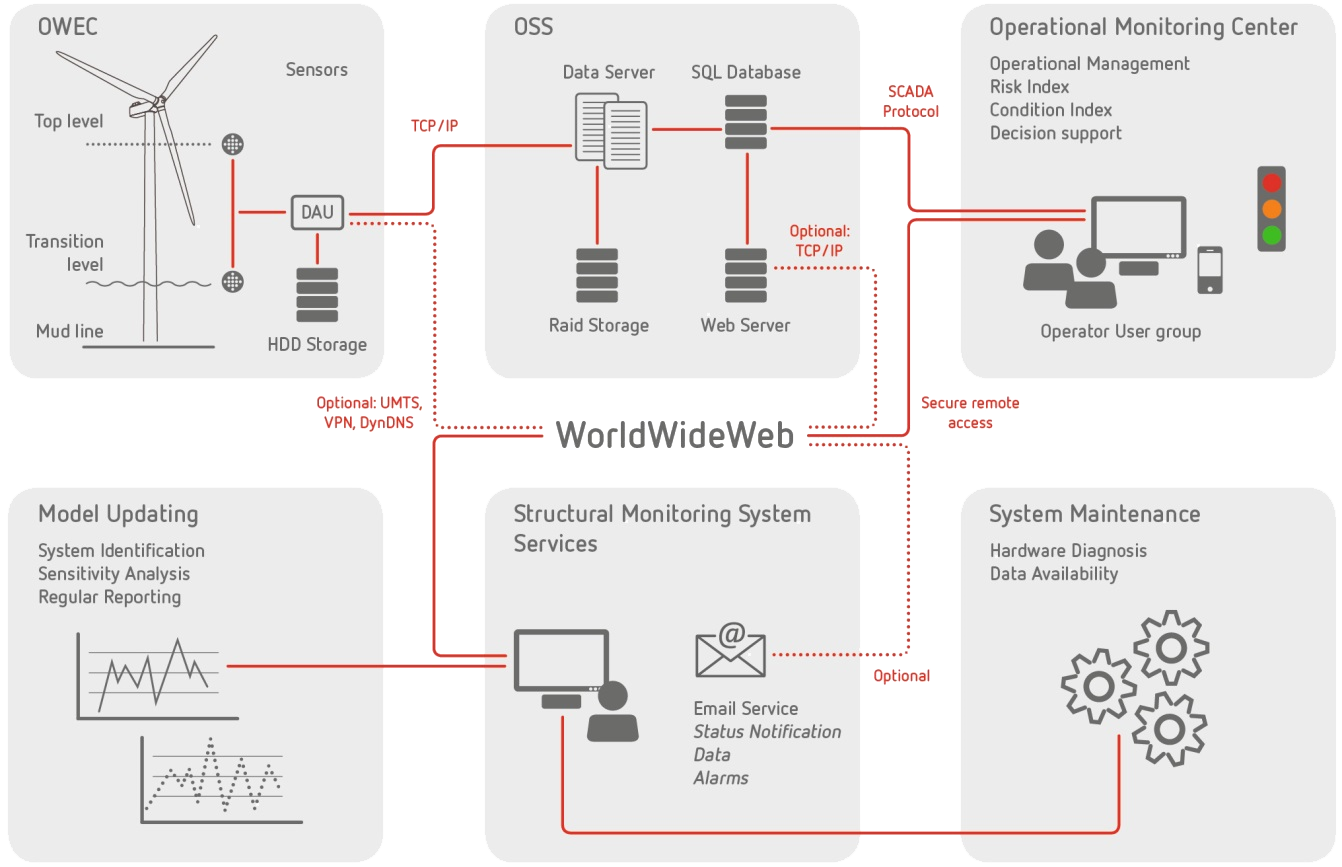
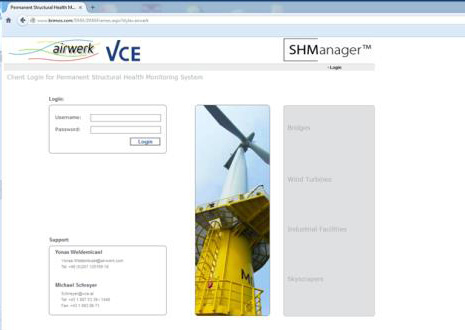
The SHManager™ Web-User-Interface, which displays all information and data to the user, is fully designed as internet service so that no additional software programs have to be installed at the terminal of the user. The application is performed via common web browsers (Internet Explorer, Mozilla, …).
The SHManager™ Web-User-Interface a number of functions to the client:
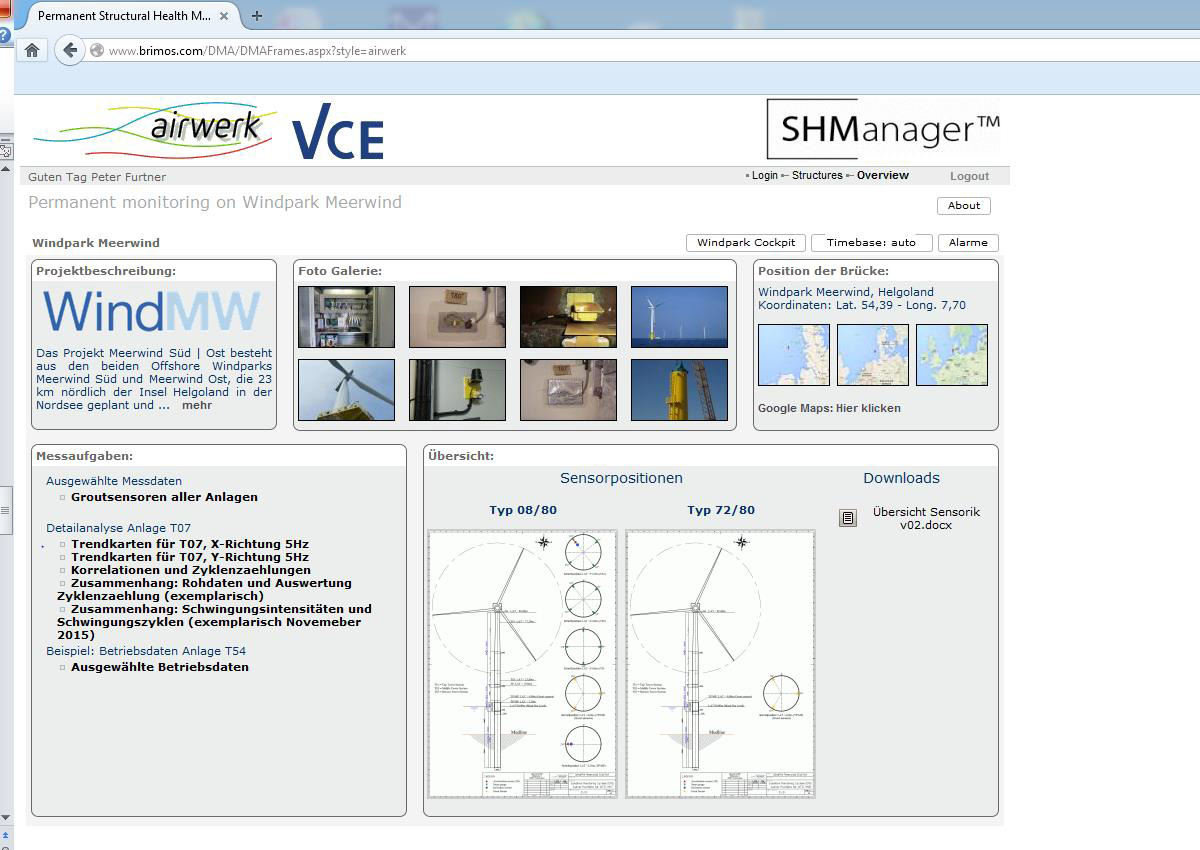
2 . General View
After login there is a general view of the monitoring project including a summary of all the relevant information ("monitoring dashboard").
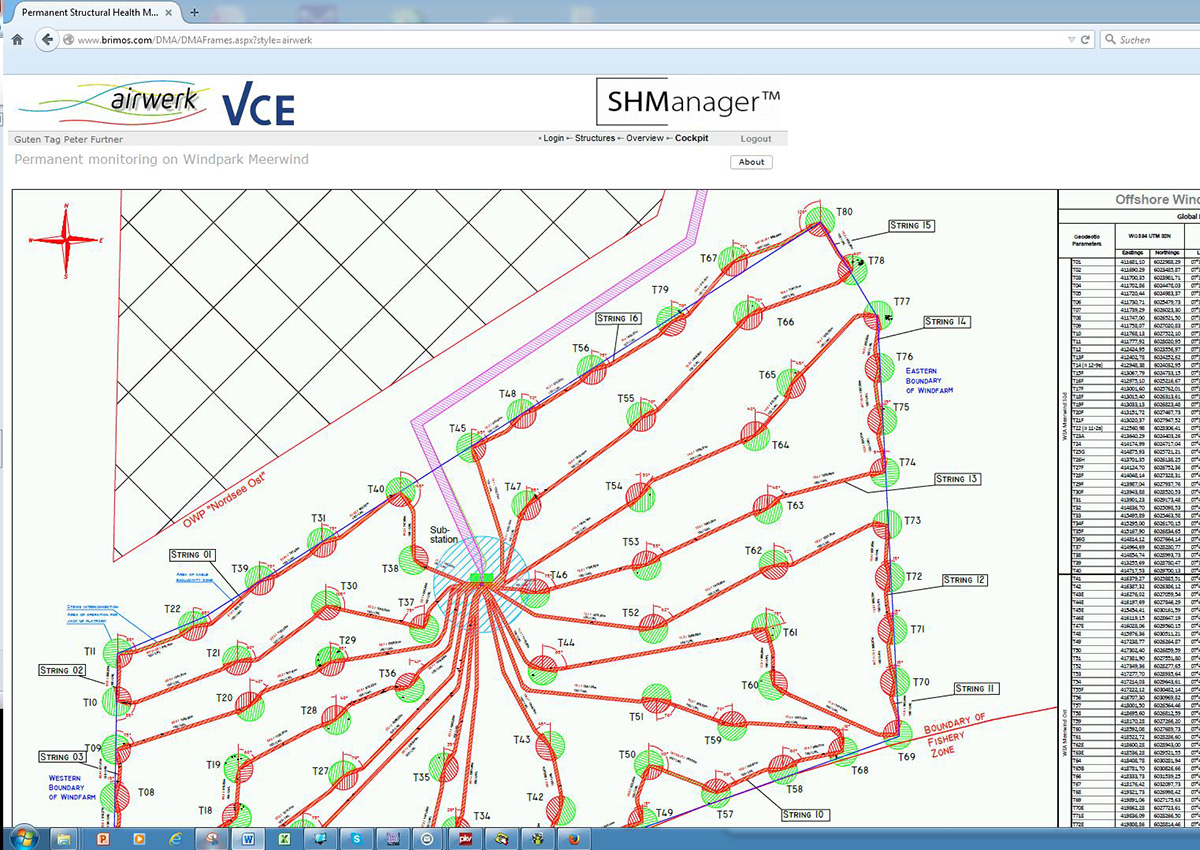
3 . Cockpit-Display
The "Cockpit-display" shows an overview on the windfarm. The individual sensor-layout of each WTG and the monitoring-data can be reached by clicking on the selected WTG.
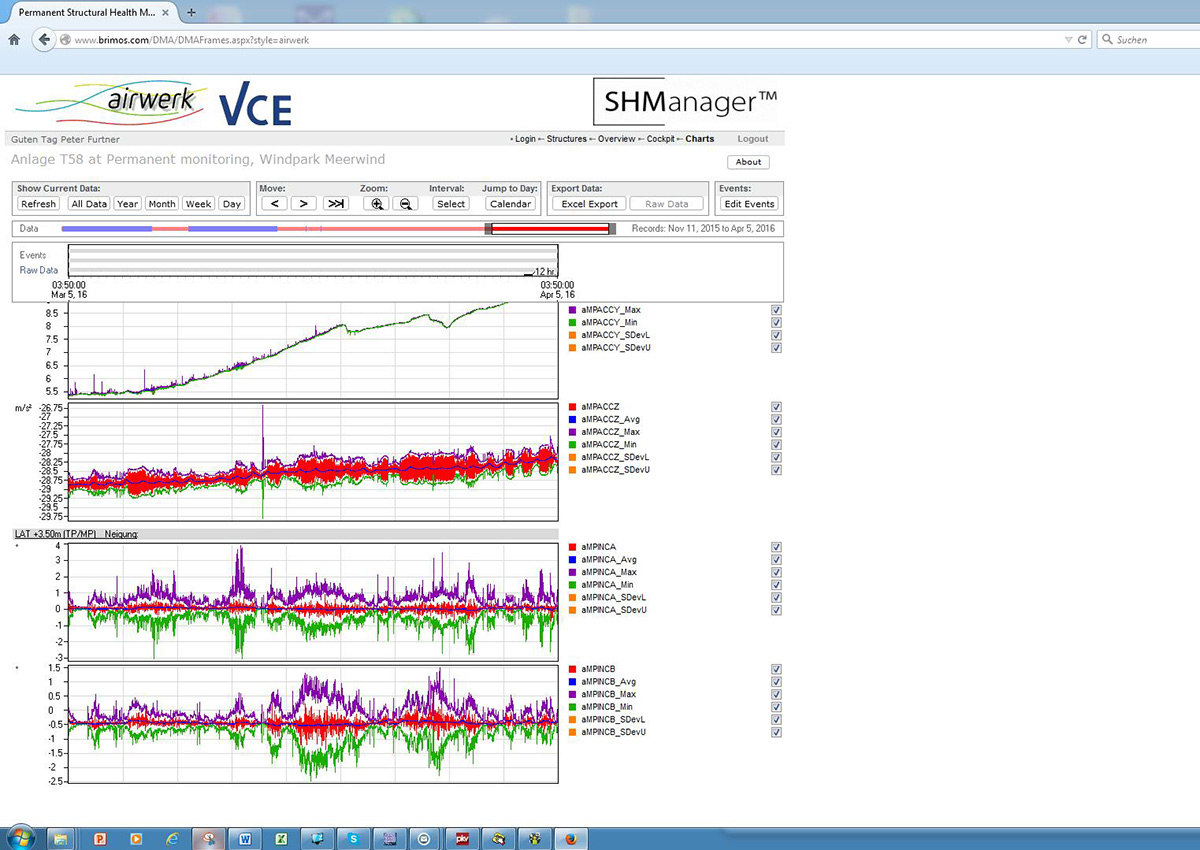
4 . Web-UI
The Web-UI allows the representation of time history charts for any number of measurement channels.
5 . Alarm Function
Furthermore there are alarm functions via e-mail or SMS, e.g. in case of exceedance or shortfall of static or dynamic threshold values, missing data input or malfunctions.
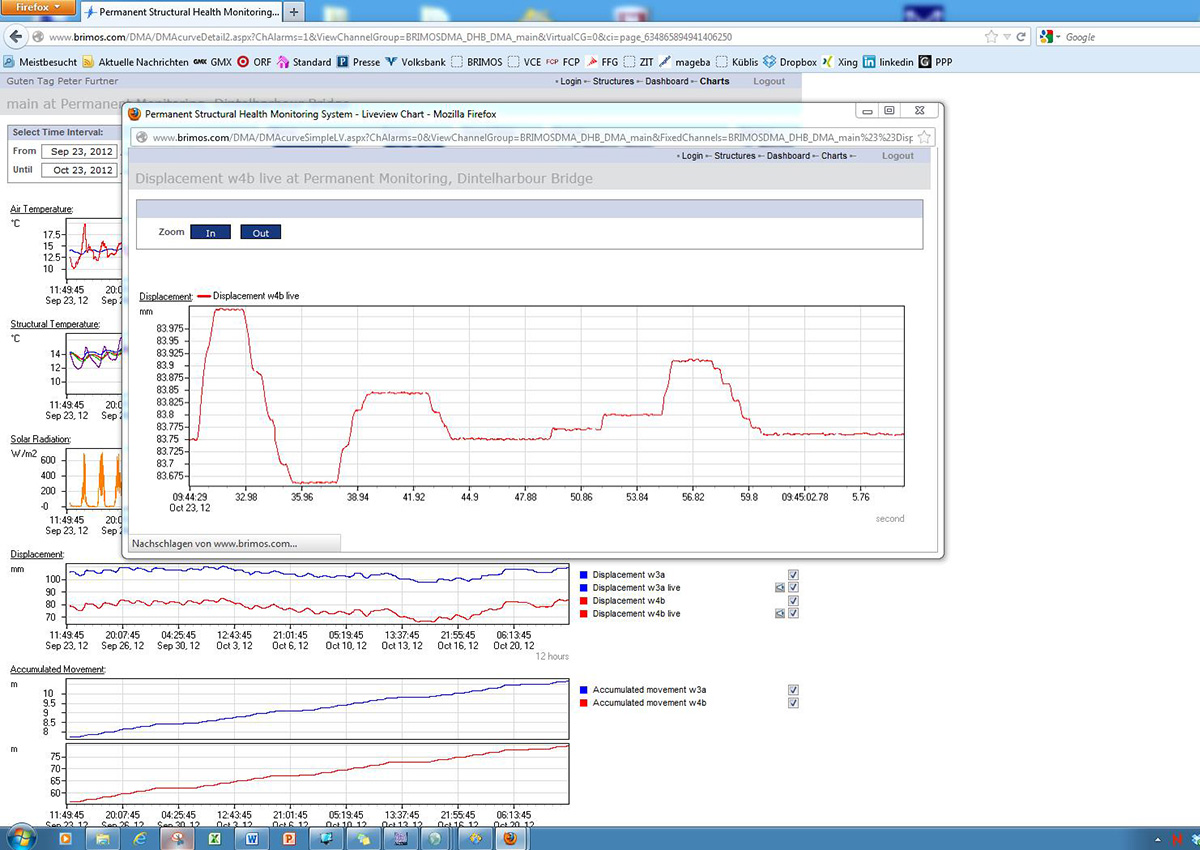
6 . Real-Time Display
Real-time display of selected measurement channels allows the presentation of continuous data flows of dynamic, high-frequency acceleration signals or other rapidly changing parameters.
7 . Data Export
Data export of all data from the time history charts in common comma-separated ASCII-format.
8 . External Data
Import of external data (operational data) via different interfaces (web forms, e-mail attachments, ftp-upload and download, database replication mechanisms, etc.).
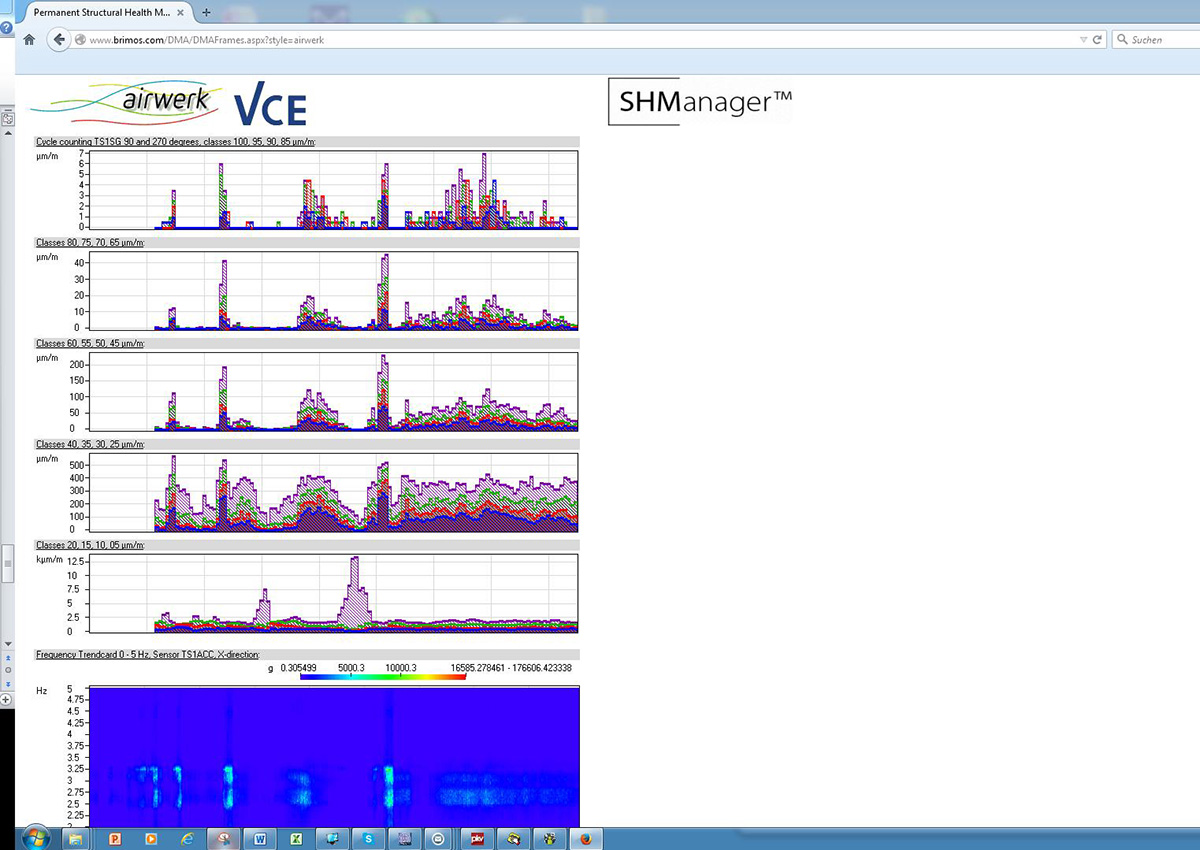
9 . Automatic Implementation
Automatic implementation of mathematical operations and analyses: calculation of correlation analyses, trend analyses, threshold criteria, classification, cycle counting, evaluations, etc.
10 . Reports
Preparation and transmission of automatically generated periodic measurement reports -the reports can be downloaded or automatically sent by e-mail.
11 . Apps
Appropriate apps are available for the access with mobile terminals like smartphones or tablets. The only constraint for this location-independent use is available internet.
A document with a more detailed overview of the options and functions of the SHManager™ Web-User Interface is available in the download area. Only the most important functions were selected for the description, numerous further options are available.
The interface is continuously further developed and complemented with additional functions and types of display.